Our best expert advisor - Pallada trading strategy
Pivot Lines for Metatrader 5
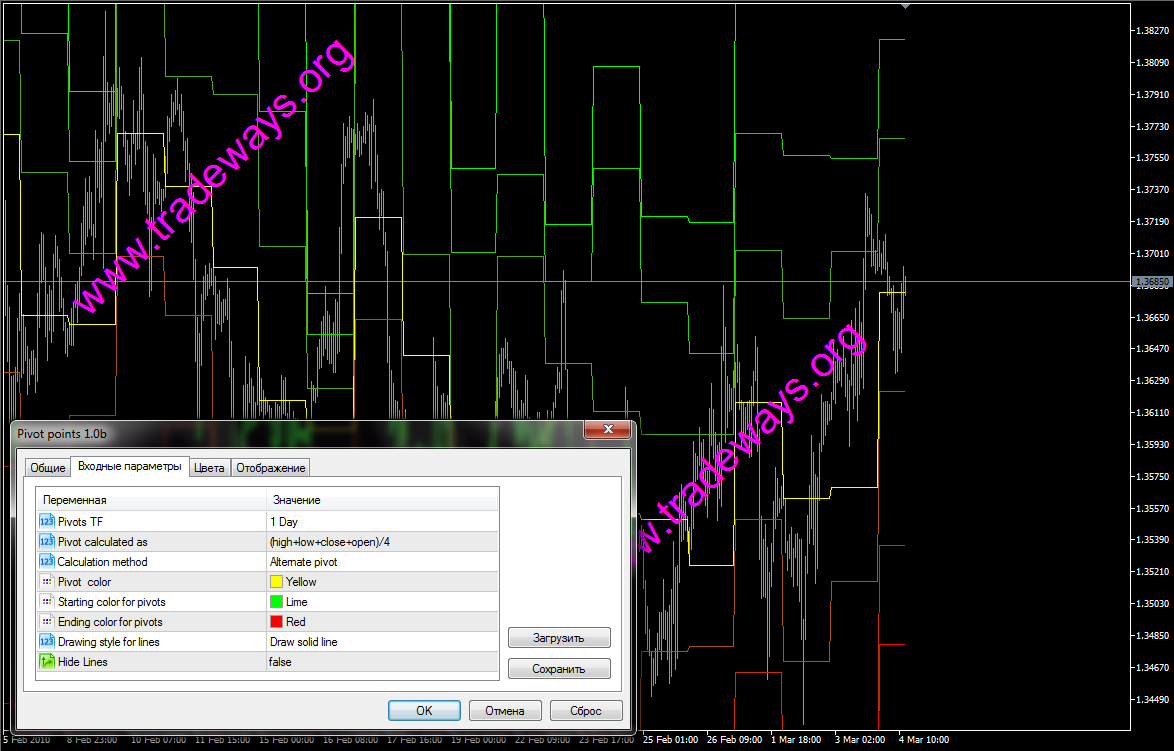
A pivot point support and resistance levels are often turning points for the direction of price movement in a market. In an up-trending market, the pivot point and the resistance levels may represent a ceiling level in price above which the uptrend is no longer sustainable and a reversal may occur. In a declining market, a pivot point and the support levels may represent a low price level of stability or a resistance to further decline.The pivot point itself represent a level of highest resistance or support, depending on the overall market condition. If the market is direction-less (undecided) prices will often fluctuate greatly around this level until a price breakout develops. Pivot Points are lines of support and resistance, calculated from the High(H), Low(L) and Close (C) price of the previous bar on different timeframes. The most commonly used is Daily Pivot (Daily Pivot Lines)
Pivot points performance is displayed on the following snapshot:
You will find all required manuals on how to use Metatrader 5 and how to install indicators here
 Our products